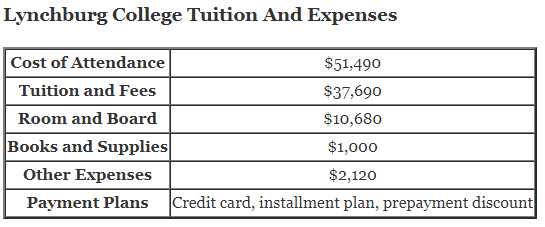
Lynchburg College Tuition And Expenses
| Cost of Attendance | $51,490 |
|---|---|
|
Tuition and Fees |
$37,690 |
|
Room and Board |
$10,680 |
|
Books and Supplies |
$1,000 |
|
Other Expenses |
$2,120 |
| Payment Plans | Credit card, installment plan, prepayment discount |
Lynchburg College Applying For Financial Aid
| Web Site | Financial Aid Web Site |
|---|---|
| Net Price Calculator URL | Net Price Calculator URL |
| Application Deadline | Priority deadline November 1 |
|---|---|
| Award Notification | On a rolling basis beginning December 1 |
| Methodology for Awarding Institutional Aid | Federal Methodology |
| Forms Required | Cost to File |
|---|---|
| FAFSA Code is 003720 | Free |
| State Aid Form |
Lynchburg College Profile Of 2016-17 Financial Aid
| Financial Aid Applicants | 474 (91.0%) of freshmen |
|---|---|
| Found to Have Financial Need | 418 (88.2%) of applicants |
| Received Financial Aid | 418 (100.0%) of applicants with financial need |
| Need Fully Met | 112 (26.8%) of aid recipients |
| Average Percent of Need Met | 81% |
| Average Award | $28,414 |
|
Need-Based Gift |
Received by 418 (100.0%) of aid recipients, average amount $25,614 |
|
Need-Based Self-Help |
Received by 336 (80.4%) of aid recipients, average amount $3,842 |
|
Merit-Based Gift |
Received by 79 (18.9%) of aid recipients |
| Merit-Based Gift | 102 (19.6%) of freshmen had no financial need and received merit aid, average amount $19,222 |
| Financial Aid Applicants | 1,611 (83.1%) of undergraduates |
|---|---|
| Found to Have Financial Need | 1,482 (92.0%) of applicants |
| Received Financial Aid | 1,470 (99.2%) of applicants with financial need |
| Need Fully Met | 302 (20.5%) of aid recipients |
| Average Percent of Need Met | 76% |
| Average Award | $27,341 |
|
Need-Based Gift |
Received by 1,461 (99.4%) of aid recipients, average amount $23,781 |
|
Need-Based Self-Help |
Received by 1,248 (84.9%) of aid recipients, average amount $4,364 |
|
Merit-Based Gift |
Received by 209 (14.2%) of aid recipients |
| Merit-Based Gift | 393 (20.3%) of undergraduates had no financial need and received merit aid, average amount $17,162 |
| 2016 Graduates Who Took Out Loans | 77% |
|---|---|
| Average Indebtedness of 2016 Graduates | $35,614 |
| Parents Borrowing PLUS Loans | |
|
Parents of Students
Receiving Aid |
Not reported |
|
Parents of Students Not
Receiving Aid |
Not reported |
Lynchburg College Financial Aid Programs
| Federal Loans | Direct subsidized Stafford loans, direct unsubsidized Stafford loans, direct PLUS loans, Federal Perkins loans |
|---|---|
| State Loans | |
| Other Loans | Alternative loans |
| Need-Based Available | Federal Pell grants, SEOG, State scholarships, Institutional scholarships, Private scholarships |
|---|---|
| Non-Need–Based Available | Academic scholarships, Creative arts/performance scholarships, Music/Drama scholarships, State scholarships, Leadership scholarships, Religious affiliation scholarships |
| Academic Interest/Achievement Award Areas | Not reported |
|---|---|
|
Number of Awards |
Not reported |
|
Top Areas (By Money
Awarded) |
|
| Creative Arts/Performance Award Areas | Art/Fine Arts, Music, Theater/Drama |
|
Number of Awards |
Not reported |
|
Top Areas (By Money
Awarded) |
|
| Special Achievements/Activities Award Areas | Not reported |
|
Number of Awards |
Not reported |
|
Top Areas (By Money
Awarded) |
|
| Special Characteristics Award Areas | Not reported |
|
Number of Awards |
Not reported |
|
Top Areas (By Money
Awarded) |
| Work-Study Programs | Federal work study available, other work study available |
|---|---|
| Average Earnings from On-Campus Employment | Not reported |